2015-07-27
Those who wish to renovate their houses and make them more energy-efficient often use the well-known yellow to blue thermal images to visually identify weak spots applying infra-red measurements. Thermographic imaging is also used in industry for materials testing. Depending on the material, however, the method can result in large measurement errors. Scientists at Kiel University have now developed a technology that visually identifies the slightest temperature differences with high spatial resolution, whatever the material. This new principle competes with other procedures as well, as reported by researchers in the current edition of the scientific journal, Advanced Materials.
In their research, the scientists in Kiel make use of the magnetic properties of a certain material. In experiments, a thin, transparent layer of a garnet compound (garnet is a mineral from the silicates category) is placed on the object to be investigated - in this case, an integrated circuit of a microchip. If the temperature anywhere on the circuit changes even by the slightest amount, the layer of material reacts by changing its magnetic properties. The warmer it becomes, the smaller the magnetisation.
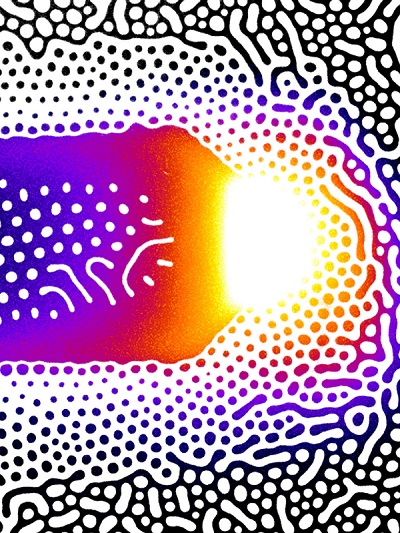
Thermographic image of an integrated circuit taken with pyro-magnetic-optics. The image shows the magnetic domains as well as heat distribution along the wires. The warmest point (yellow to white) indicates that the wires are close to each other in a confined place. Temperatures differ about 0.5 to 1 degree Celsius.
Image/Copyright: McCord
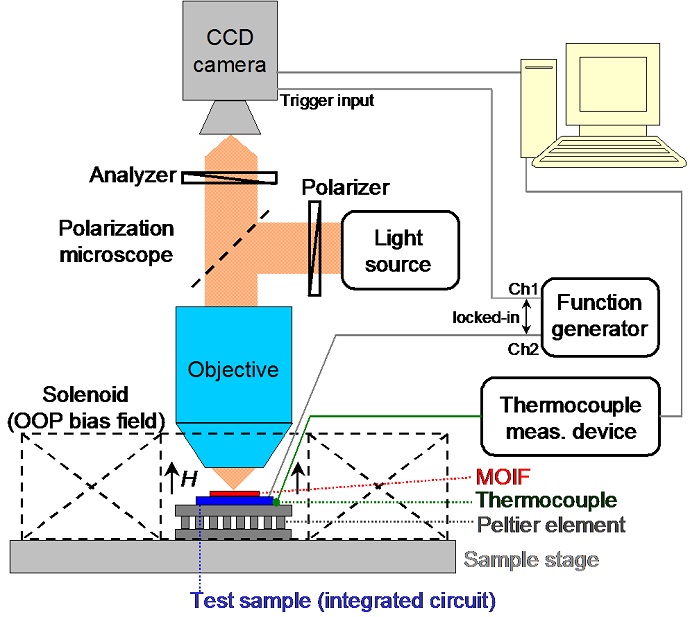
This magnetisation, being different depending on the temperature, can be made visible with a so-called polarisation microscope: polarised light is light that is forced into a certain direction of oscillation (similar to some sunglasses). When it reaches the surface of the thin layer, it is reflected differently, depending on the materials’ magnetisation. A digital, light-sensitive camera captures the reflected light. The magneto-optical images show the temperature distribution in the circuit and the tiny magnetic domains of the material; these are separate areas that have the same polarisation.
The material developed by the physicists in Kiel works as an extremely precise temperature meter. The method can display minimal changes of up to one hundredth of a degree Celsius, which take place in milliseconds, with a resolution of micrometres. Professor Jeffrey McCord, head of the study at the Kiel Institute for Materials Science, is positive that "Our technology therefore opens up brand new possibilities for different thermographic imaging applications." New models of thermographic cameras are conceivable. The new procedure called “Pyro-Magnetic-Optics” could, in particular, make error analysis of electronic components easier and more precise.
The research results were achieved together with scientists from the Russian Tver State University and the Russian Research Institute for Materials Science and Technology.
Original publication:
Kustov, M., Grechishkin, R., Gusev, M., Gasanov, O. and McCord, J. (2015), A Novel Scheme of Thermographic Microimaging Using Pyro-Magneto-Optical Indicator Films. Adv. Mater.. doi:10.1002/adma.201501859
Link: http://dx.doi.org/10.1002/adma.201501859
Source:
http://www.uni-kiel.de/pressemeldungen/index.php?pmid=2015-275-magnetooptik&lang=en